This web page was produced as an assignment for Genetics 564, an undergraduate capstone course at UW-Madison
What is phylogeny?
Phylogeny is a way to study evolutionary relationships among species. The typical way to represent a phylogeny is by creating trees that depict these relationships. To provide insight on where the organisms of interest fall on the tree of life, one distantly related organism is added to the trees, this is called the outgroup [1]. In the past these trees were built based on taxonomy, the classification and naming of a species. However, with the advancement in DNA sequencing techniques, these trees can now be built based on genome or protein sequences. The phylogenetic trees that are built here (Fig 1-4), using Clustal Omega, are based on the homologous protein sequences found in various species, which can be found on the homology page. [2]
How are similarities calculated between sequences?
Percent Identity
The percent identity method looks at what percentage of aligned sequences are identical. [3]
BLOSUM Matrix
The BLOSUM matrix scores the similarities between sequences by looking at each amino acid in aligned sequences and if they are a match, calculating the likelihood a match would occur in that position in a random sequence. The scores along the whole sequences are then summed to find the total score of the aligned sequences. This score reflects how similar the sequences are to one another. [4]
How are trees drawn?
Average Distance
The average distance method determines the closest related species by using similarity scores and connects them using equal length branches. However, this makes the assumption that both species have gone through equal amounts of divergence since the common ancestor. [3]
Neighbor Joining
The neighbor joining method creates phylogenetic trees using evolutionary distance data to create the shortest trees possible. The calculations can be done using percent identity or BLOSOM [3]. Then the lengths of the branches depict how much change has occurred since the two species diverged. [5]
Phylogenetic trees for MITF protein homologs
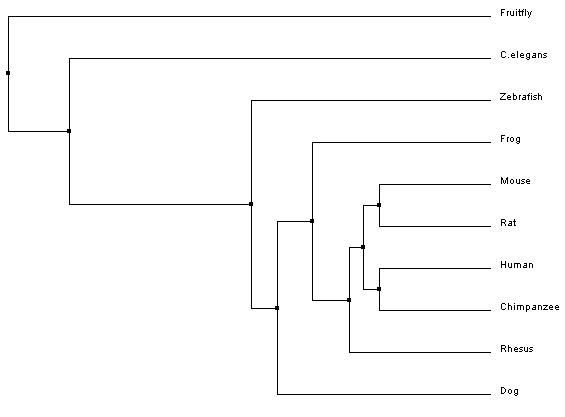
Fig. 1 Average distance tree using BLOSUM62
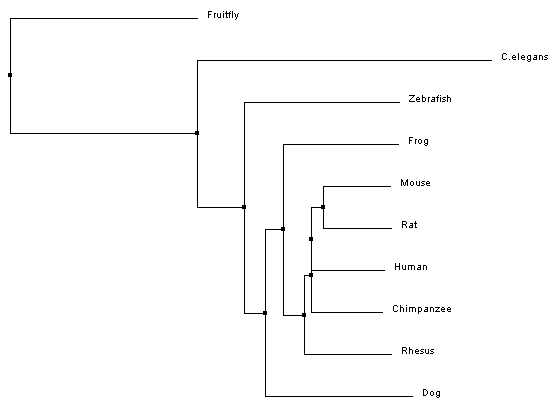
Fig. 3 Neighbour joining tree using BLOSUM62
|
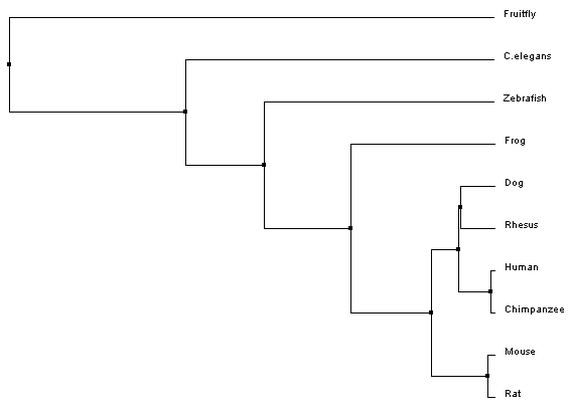
Fig. 2 Average Distance tree using PID
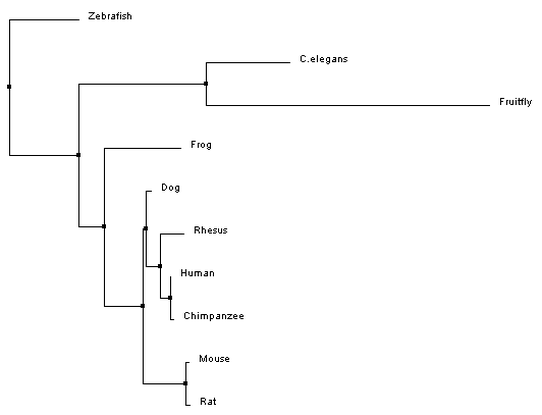
Fig. 4 Neighbour joining tree using PID
|
Analysis
All of the trees that were constructed are slightly different, but are ultimately showing quite the same information. For both the average distance trees and the neighbour joining tree using BLOSUM62, Fruitfly is the outgroup. The neighbour joining tree using PID shows Zebrafish as the outgroup. However, Fruitfly (along with C. elegans) is still set apart from the main group of mammals and amphibian.
